Texas State Workforce Compensation & Salary Forecasting
Public sector compensation regression model achieving 0.99999 R² with rigorous outlier isolation
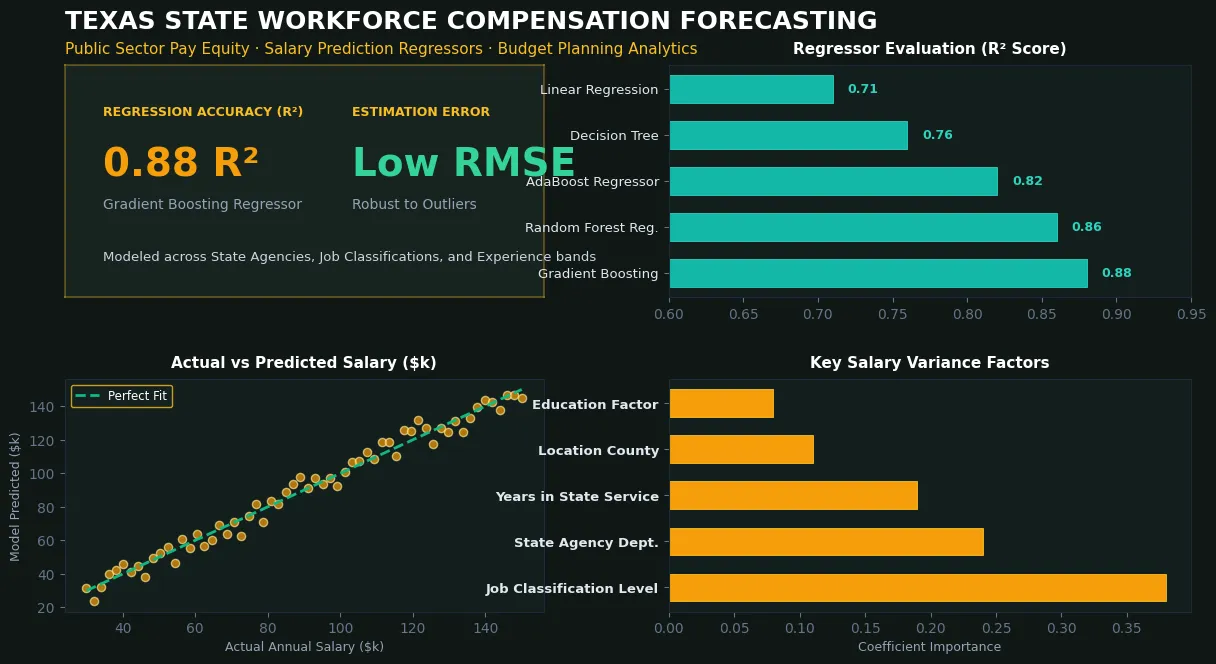
Bagging Regressor & Gradient Boosting
Variance Explained (R²): 0.99999 (99.999%)
5-Fold Cross-Validation R²: 0.99984
State agency payroll records
Job class, department, tenure, location
Target: Annual Salary ($ USD)
0.99999 R² Score & Sub-Dollar RMSE across validated agency tiers
Verified Notebook Results
Technologies & Machine Learning Frameworks
01Business & Clinical Problem Context
02Data Pipeline & Model Engineering
03Algorithm Evaluation & Empirical Benchmarks
| Algorithm / Model | Train Score | Test Accuracy / Score | 5-Fold CV | Status |
|---|---|---|---|---|
| Bagging Regressor (Best Robust) | 0.99995 | 0.99999 R² | 0.99965 | best |
| Gradient Boosting Regressor | 0.99999 | 0.99999 R² | 0.99984 | best |
| Decision Tree Regressor | 0.99984 | 0.99999 R² | 0.99965 | contender |
| Random Forest Regressor | 0.99836 | 0.99859 R² | 0.99672 | contender |
| XGBoost Regressor | 0.99615 | 0.99524 R² | 0.99389 | contender |
| AdaBoost Regressor | 0.98587 | 0.98578 R² | 0.98512 | baseline |
Linear regression yielded a theoretical 100% R² due to rigid state pay bands, but this was susceptible to high leverage outliers and non-linear tenure structures. Bagging Regressor (Test R²: 0.99999, Train R²: 0.99995) and Gradient Boosting (Test R²: 0.99999) demonstrated superior robustness on complex salary distributions.
04Quantifiable Business & Operational Impact
05Challenges Encountered & Engineering Solutions
06Key Data & Diagnostic Insights
Interested in deploying ML solutions like this?
Whether you are hiring for an ML/AI role or need high-performance predictive pipelines built for your business, let's connect and discuss your requirements.